Energy Brain Cloud is the NEW, browser-based software that allows you to view and manage via a web browser on various devices such as PC, tablet, smartphone data and measures acquired by Electrex instruments.
Starting from version 4.0 its also possible to control the devices and send commands.
The cloud computing technology makes possible to manage the collected data via a standard Internet browser without installing any software on the user’s computer or mobile device.
Energy Brain Cloud can run in a local machine (on-premises), installed in a dedicated web server (SaaS) or offered as a service by Electrex or third parties.

Energy Brain Cloud is composed of an instrument panel (dashboard) in which it is possible to manage several functions. The basic elements of the dashboard are graphical components called widgets. Through the widgets the user can view, among instantaneous and historical values , states (on / off), alarms, etc.. using standard or custom graphical interfaces.


CONTACT US to get the login credentials for the demo version of Energy Brain Cloud 4.0
with live and historical data acquired from various Electrex instruments installed in our headquarters.
The dashboard
The user can select the Widget with the desired measures and compose their own personalized dashboard.
The widgets can be organized in multiple tabs with editable titles.

Tab showing a chart on the energy consumption and the relative cost in EUR.

Tab containing: a widget with live data and customized graphics (icon-background), a graph with the supply and return water temperature of a boiler and a heat pump, a widget with the graph related to the gas consumption.

Tab containing a scenario widget obtained using a background image upon which are placed instantaneous measurements (energy, temperature, lux, etc.); a widget showing the humidity measurement; a widget with a customized icon showing the CO2 concentration value; a widget for the ambient temperature; a widget with the graph of the energy consumed from the lighting system and the relative operating hours of the lights.
The Menù
In order to compose the dashboard, the user has at its disposal the following menu:

The menu allows to:
Create, change position by dragging and configure the widgets. It’s possible also to set alarms/notifications (graphical / on display or audio type) triggered by a value threshold monitoring.

Every widget previously moved to the Trash can be restored or removed definitively.

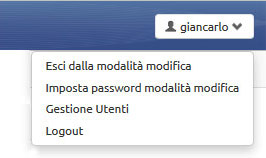
Using the menu on the right side, the administrator has access to the user management section. The standard users, if previously enabled from the admin, can edit the dashboard and the widgets.
The widgets
The widgets can display the measurements retrieved by all the Electrex instruments: electricity, temperature, humidity, luminosity, gas, water, steam, CO2, compressed air, calories, etc., or values calculated starting from a measurement (e.g. cost of energy in Euro).

There are three types of widgets:
1- Measure
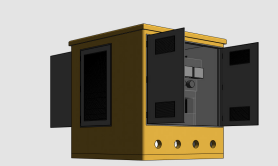
The Measure widgets show instantaneous measurements, total counters, alarms, status (On/Off). It is possible to choose between three widget types: Gauge, Analog counter and Custom Background. The last one allows to upload a jpg, png and gif image and use it as the widget’s background.

|

2 – Graphs
The Graph widgets display graphs with historical data retried from the Electrex devices.

All the data displayed on the graph are listed in a table positioned below the graph and can be exported in a CSV file.

3 – Scenario
In the Scenario widgets it is possible to upload an image (jpg, png and gif) and use it as a background on which are overlaid tooltips showing measurements from Electrex devices. The tooltips can be positioned just by “drag and drop” permitting to set up a mimic diagram.

Command configuration menu

Widget Scenario with measure tooltips and command buttons

Widget Scenario with measure tooltips on building plant

Widget Scenario with measure tooltips and alarm notification related to production line
The interactive modality of the Graph widget
Clicking on the zoom icon it is possible to enter in the interactive modality of the Graph widget.

Daily temperature (°C) and humidity(%)graph

Weekly electricity (kWh per each tariff) graph

Monthly energy costs (in Euro per each tariff) graph
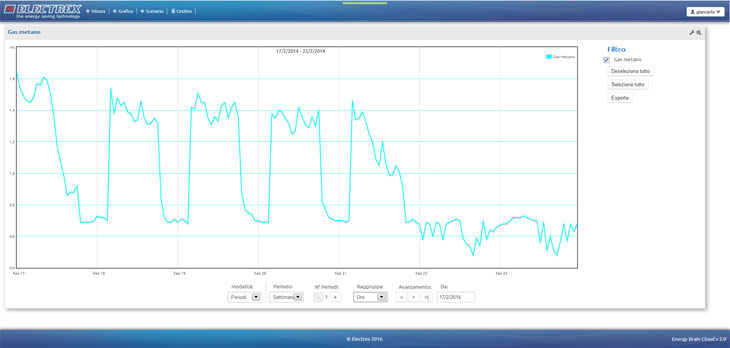
Weekly gas consumption graph(mc)
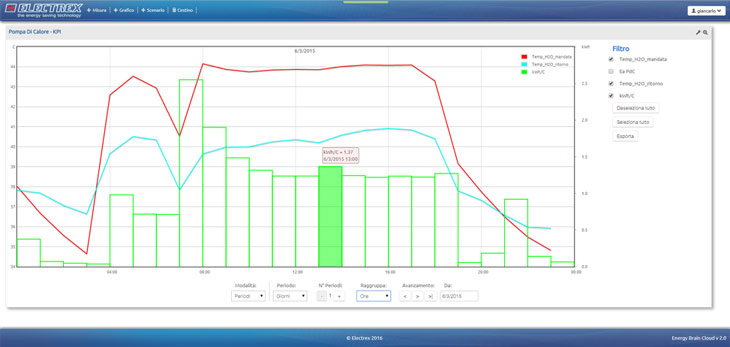
Daily graph on the Key Performance Indicator – KPI of a heat pump
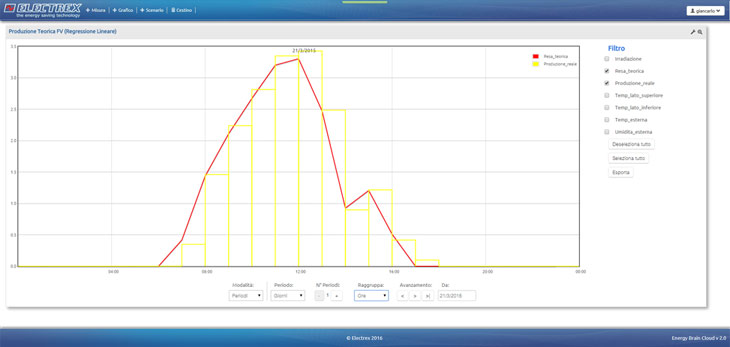
Daily graph of the energy production of a PV system with the relative baseline
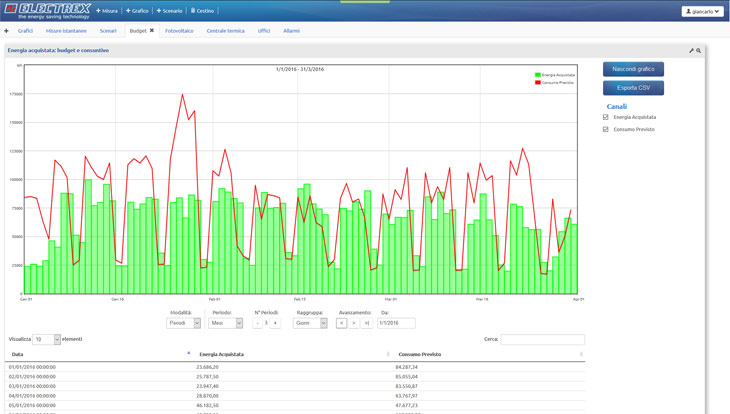
Monthly graph and the relative table of samples of the energy consumed and the budget forecast
Within the interactive modality it is possible to:
Show or hide the curves displayed on the graphs.

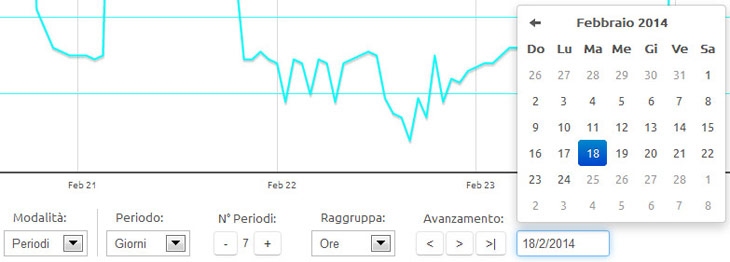
Change the time period to which the data refer and their grouping unit (hours, days, weeks, months, years).
Display through tooltip the value displayed on the graph.
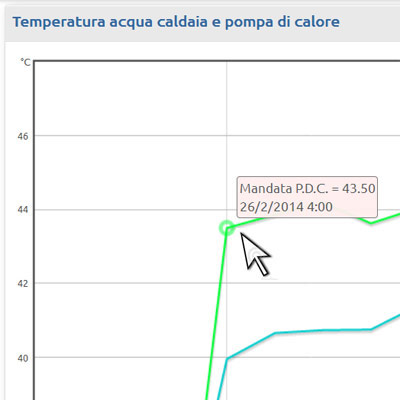
Supply Water temperature (°C) of a heat pump
‘Zoom’ on the graph area / bars.
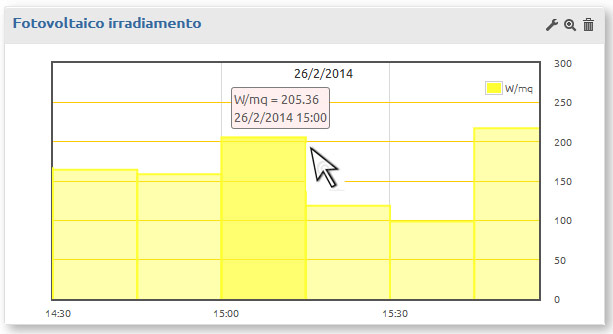
Zoom on the irradiance (w/mq) value measured in a PV system
Export the data in CSV files.
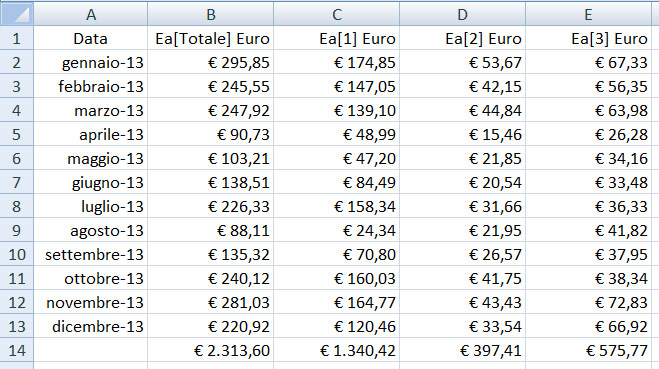
Costs of electricity (Euro) per each month
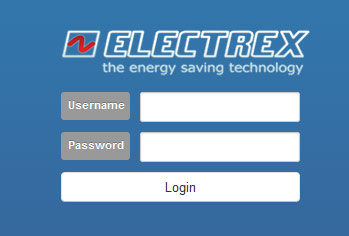
Multi-user interface
Energy Brain Cloud allows multi-user through an authentication interface. Each user can access only the data that has been enabled by the system administrator.
Versions
Energy Brain Cloud can be used in various modalities:
- Local (on-premises): the application is installed at the end user’s facility which manages it autonomously and makes the data available only within its local LAN
- Remote (SaaS): the application is installed at the end user’s service provider which manages it autonomously and makes the data available both within its local LAN and externally
- Service managed by third parties: a third party (energy consultants, Energy Service Company, trade associations, etc.) installs and manages Energy Brain Cloud at its headquarters and makes available to its customers / associates their data as a service
- Service managed by Electrex: we take care of downloading the data of the instruments installed at the end user’s facility and we make them available as a service.
CONTACT US to get the login credentials for the demo version of Energy Brain Cloud 4.0
with live and historical data acquired from various Electrex instruments installed in our headquarters.